Description
An introduction on how graphical representations of data can be used to aid understanding. This course
details the theory and practice of designing effective information or scientific visualizations. The
techniques learned in this class have wide applications to all fields in engineering and science,
where due to increasing sizes and complexity data now demands effective presentation and analysis.
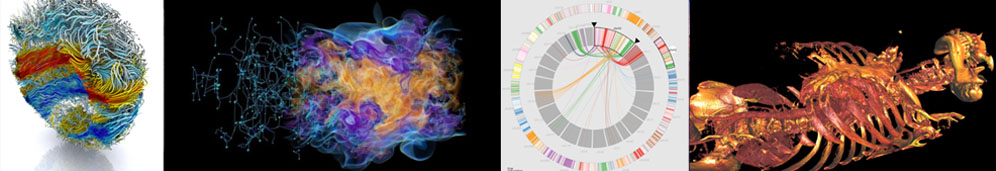
Topics will include isosurfaces, volume rendering, transfer functions, vector/tensor fields,
topological analysis, large data visualization, and uncertainty in visualizations.
Learning Outcomes
Upon completion of the course, successful students will be able to:
- understand the current state-of-the-art in visualization technologies;
- understand the underlying perceptual theory, mathematics, algorithms, and data structures that drive visualizations
- create interactive 2D/3D information and scientific visualization programs
- CMPS 1600 or good programming skills (C and C++ and javascript will be used in the course)
Instructor
Office Hours
TBD
Times
Monday, Wednesday and Friday, 10:00AM - 10:50AM, ST 302
Book
Required:
- Visualization Analysis and Design, Tamara Munzner, CRC Press (2014)
Recommended Resources:
- Interactive Data Visualization for the Web, Scott Murray, O’Reilly (2013) Free Online
- VTK User's Guide, Kitware, Kitware (2013)
Undergrads:
10% Participation
15% Quizes
45% Assignments
30% Final Exam
Grads:
10% Participation
15% Quizes
15% Paper Reading
30% Assignments
30% Final Project
Assignment Late Policy: 20% reduction within 1 week of due date (not applicable to projects)
Grad students (required) and advanced undergrads (in lieu of a final exam) will have the option to complete a visualization
project using the concepts outlined in this course. Projects must be pitched and approved by the instructor by 6th
week of the semester. Projects must be significant in scope to receive approval. On example of a final project
is to implement a technique from an
IEEE SciVis or InfoVis paper from the past 5 years.
You are required to adhere to the
Code of Academic Conduct. Cheating
will be reported to the Associate Dean of Newcomb-Tulane College. I encourage collaboration, but everyone's work
must be their own. Help and sharing of small code snippets to help someone get past a bug are OK, but whole files
or classes are not. Sources other than the textbook should be cited appropriately.
Tulane University recognizes the inherent dignity of all individuals and promotes
respect for all people. As One Wave, Tulane is committed to providing an environment
free of all forms of discrimination and sexual harassment, including sexual assault,
domestic and dating violence, and stalking. If you (or someone you know) has
experienced or experiences gender-based violence, know that you are not alone.
Learn more at
onewave.tulane.edu.