Visualization banner

Visualization
CMPS 3120 Spring 2016

Course Information

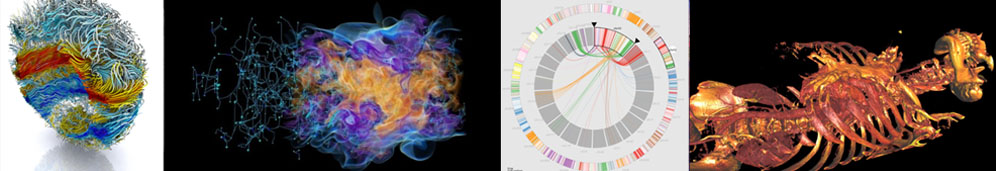
An introduction to how graphical representations of data can be used to aid understanding. This course details the theory and practice of designing effective information or scientific visualizations. The techniques learned in this class have wide applications to all fields in engineering and science, where due to increasing sizes and complexity data now demands effective presentation and analysis. Topics will include iso-surfacing, volume rendering, transfer functions, vector/tensor fields, topological analysis, large data visualization, and uncertainty in visualizations.
Scientific American recently had a blog post on our community at our main conference.

Prerequisites
  • CMPS 1600 or good programming skills (C and C++ and javascript will be used in the course)
Instructor Office Hours
Monday and Wednesday, 11:00AM - 12:00PM, ST 307A
TA: Mondays from 2:00PM-4:00PM and Wednesdays from 11:00AM-12:00PM
Times
Monday, Wednesday and Friday, 10:00AM - 10:50AM, ST 302
Book
Required:
  • Visualization Analysis and Design, Tamara Munzner, CRC Press (2014)
Recommended Resources:
  • Interactive Data Visualization for the Web, Scott Murray, O’Reilly (2013) Free Online
  • VTK User's Guide, Kitware, Kitware (2013)
Grading
10% Participation
15% Quizes
45% Assignments
30% Final Project/Exam

Assignment Late Policy:

  • 20% reduction within 1 week of due date
  • Not applicable to the Final
Discussion
We will be using Piazza for class discussion. Please use this as a resource to ask me and your classmates questions pertaining to course material, labs, and projects.
Find our class page at: https://piazza.com/tulane/spring2016/cmps31206120/home
Collaboration and Academic Integrity
You are required to adhere to the Code of Academic Conduct. Cheating will be reported to the Associate Dean of Newcomb-Tulane College. I encourage collaboration, but everyone's work must be their own. Help and sharing of small code snippets to help someone get past a bug are OK, but whole files or classes are not. In cases of over sharing, everyone involved will be held equally responsible irregardless of who did the original work. To help avoid misunderstandings, I encourage coding help to be done via Piazza. This keeps things clear for me when grading, allows the entire class to learn from the fix, and gives people easy points towards class participation. Sources other than the textbook should be cited appropriately.
One Wave
Tulane University recognizes the inherent dignity of all individuals and promotes respect for all people. As One Wave, Tulane is committed to providing an environment free of all forms of discrimination and sexual harassment, including sexual assault, domestic and dating violence, and stalking. If you (or someone you know) has experienced or experiences gender-based violence, know that you are not alone. Learn more at onewave.tulane.edu.
Schedule

Since this is a new course, timing and topics may be adjusted.

Date Topic
Jan 11 Introduction
Jan 13, 15 Graphics Background
Jan 20, 22 Perception, Cognition, Color
Jan 25, 27, 29 Marks and Channels
Feb 1, 3, 5 Views, Focus, and Interaction
Feb 10, 12, 15 Tabular Data, Trees, and Graphs
Feb 17, 19 Maps and Geospatial
Feb 22, 24, 26 Visualizing Text and Sets
Feb 29, Mar 2, 4 Grids and Isosurfaces
Mar 7, 9, 11 Volume Rendering and Transfer Functions
Mar 14, 16, 18 Advanced Volume Rendering and Transfer Functions
Mar 18, 20, Apr 1 Flow Visualization, Vectors, and Tensors
Apr 4, 6, 8 Topological Features
Apr 11, 13, 15 Large Data Visualization
Apr 18, 20, 22 Dealing with Uncertainty
Apr 25 Visualization Case Studies
Assignments

Final Project

The final project is an open-ended visualization assignment. Produce a cool (an informative!) visualization using concepts outlined in this course. Projects must be pitched and approved by the instructor by the middle of the semester. Example project ideas:
Resources